BREAKING: Xavier Becerra Bolts Into First Place in IVN California Governor Poll
Survey of 3,404 verified California voters shows Democrat in front. Second-choice data reveals where Yee's supporters are headed.
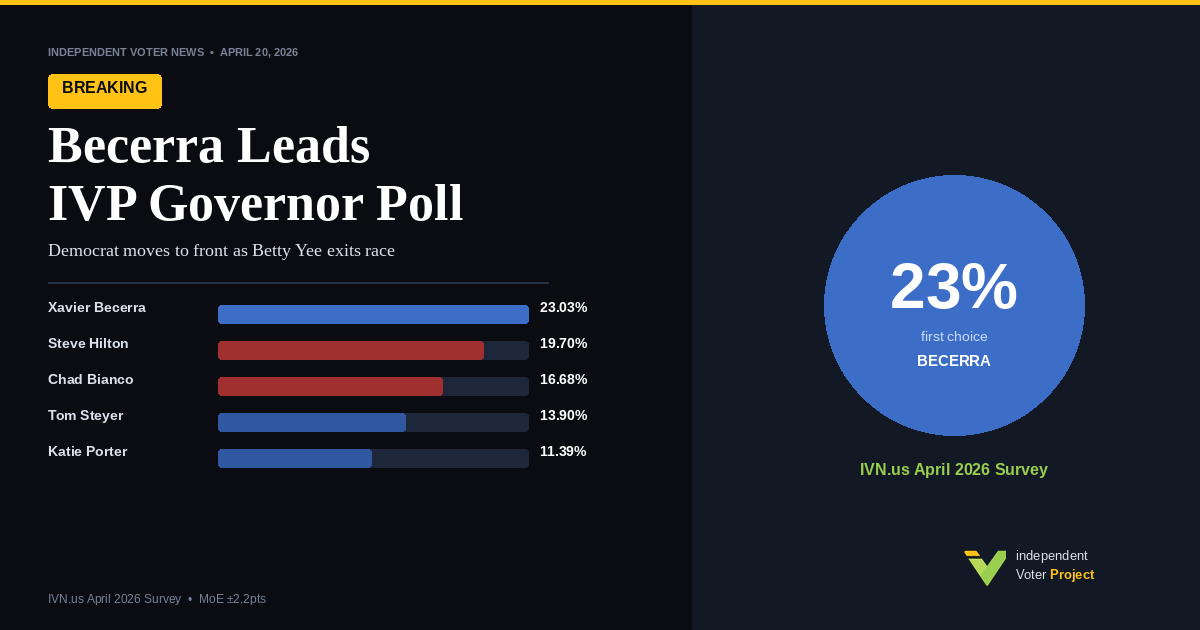
SACRAMENTO, Ca. - A new Independent Voter Project survey of 3,404 California likely primary voters shows Xavier Becerra leading the race for governor at 23 percent. Republican Steve Hilton follows at 19.7 percent, with fellow Republican Chad Bianco at 16.68 percent, Democrat Tom Steyer at 13.9 percent, and Katie Porter at 11.39 percent.
The survey was conducted April 14-20 among verified registered voters drawn directly from the California voter file. Every respondent was required to have a documented history of participation in at least three of the last four major statewide elections. Full results are available at the link below.
Unique to Independent Voter News (IVN), you can view more questions, crosstabs, and do your own analysis by visiting the IVN.us data studio.
First-Choice Results
| Candidate | Share | Party |
|---|---|---|
| Xavier Becerra, Voting Rights Attorney | 23.03% | D |
| Steve Hilton, Small Business Owner | 19.7% | R |
| Chad Bianco, Riverside County Sheriff | 16.68% | R |
| Tom Steyer, Climate Advocate | 13.9% | D |
| Katie Porter, Consumer Protection Advocate | 11.39% | D |
| None / Other | 8.07% | |
| Matt Mahan, Mayor of San Jose | 4.25% | D |
| Betty Yee, Family Care Navigator | 1.12% | D |
| Antonio Villaraigosa, Housing Affordability Advocate | 0.99% | D |
| Tony Thurmond, CA Superintendent of Public Instruction | 0.87% | D |
Second-Choice Results
The survey asked all respondents for a second choice. None / Other leads at 19.92 percent, followed by Chad Bianco at 16.4 percent, Steve Hilton at 14.01 percent, and Katie Porter at 13.41 percent. Becerra draws 11.8 percent as a second choice.
| Candidate | Share | Party |
|---|---|---|
| None / Other | 19.92% | |
| Chad Bianco, Riverside County Sheriff | 16.4% | R |
| Steve Hilton, Small Business Owner | 14.01% | R |
| Katie Porter, Consumer Protection Advocate | 13.41% | D |
| Xavier Becerra, Voting Rights Attorney | 11.8% | D |
| Tom Steyer, Climate Advocate | 10.9% | D |
| Matt Mahan, Mayor of San Jose | 4.84% | D |
| Antonio Villaraigosa, Housing Affordability Advocate | 3.87% | D |
| Betty Yee, Family Care Navigator | 2.57% | D |
| Tony Thurmond, CA Superintendent of Public Instruction | 2.27% | D |
Betty Yee Drops Out
Betty Yee announced her exit from the race today. She received 1.12 percent of first-choice votes in this survey. Because the IVP poll captured second-choice preferences from all respondents, the data shows directly where her supporters are likely to go.
Among voters who selected Yee as their first choice, Becerra leads as second choice at 25.52 percent, followed by None / Other at 21.37 percent, Katie Porter at 21.18 percent, and Tom Steyer at 20.43 percent. Republican candidates draw almost nothing from her base: Chad Bianco receives 1.86 percent.
Yee's voters are 67.9 percent registered Democrat and 32.1 percent No Party Preference. Her coalition skews older, with 42.2 percent aged 65 or above, and is racially diverse: 27.4 percent identify as Black, 41.1 percent as White, and 10.9 percent as Asian.
Second-Choice Votes Among Betty Yee First-Choice Voters
| Candidate | Share | Party |
|---|---|---|
| Xavier Becerra, Voting Rights Attorney | 25.52% | D |
| None / Other | 21.37% | |
| Katie Porter, Consumer Protection Advocate | 21.18% | D |
| Tom Steyer, Climate Advocate | 20.43% | D |
| Matt Mahan, Mayor of San Jose | 5.95% | D |
| Antonio Villaraigosa, Housing Affordability Advocate | 2.69% | D |
| Chad Bianco, Riverside County Sheriff | 1.86% | R |
| Tony Thurmond, CA Superintendent of Public Instruction | 0.99% | D |
About This Poll
Most public polling uses a self-reported likely voter screen: respondents are asked whether they plan to vote, and those who say yes are included. The IVP survey takes a different approach. Every respondent was drawn directly from the L2 California voter file and required to have actually voted in at least three of the last four major statewide elections, including at least one primary and one general. No one is included based on stated intent alone.
That distinction matters most in a primary, where turnout is lower and more habitual than in a general election. Self-reported screens tend to oversample people who think they will vote but historically do not, which can skew results. The IVP model is anchored entirely in verified past behavior.
The survey also asked voters for a second choice alongside their first, which most polls do not do. That design decision made it possible to report meaningfully on where Betty Yee's voters are headed the same day she exited the race.
IVP is a nonprofit with no candidate or party clients. Most polling that circulates during a primary is commissioned by campaigns, independent expenditure committees, or media organizations with a commercial stake in the race. That does not make those polls invalid, but the funding source is relevant context when evaluating what any survey is designed to measure.
Survey Methodology
The IVP 2026 April Reform Survey was conducted April 14-20, 2026, among 3,404 screened and verified registered California voters drawn from the L2 California voter file. Eligibility required participation in at least three of the last four major statewide elections — the June 2022 primary, November 2022 general, March 2024 primary, and November 2024 general — including at least one primary and one general. Newly registered voters were eligible with participation in at least one of the four elections. Respondents were reached through MMS outreach to verified cell phone records and Meta placements targeted exclusively to voter file-matched audiences. Duplicate submissions, timestamp anomalies, and unmatched records were excluded before analysis.
The weighted electorate composition is 47.7 percent Democratic, 30.2 percent Republican, and 22.1 percent independent. Unweighted party subgroups: Democrats n=1,232; Republicans n=1,148; independent registrants n=1,024. The overall margin of error is plus or minus 2.2 percentage points at the 95 percent confidence level, adjusted for the design effect of weighting using Kish's effective sample size of 2,038. Subgroup margins of error are plus or minus 3.4 points for Democrats, plus or minus 3.5 points for Republicans, and plus or minus 4.4 points for independent voters.
This survey is designed to represent California's consistent primary electorate. It does not assume a surge among lower-propensity or newly registered voters. A material change in turnout composition, particularly among independent voters, would alter projected ballot dynamics.